
Journal Level Metrics

Journal level metrics are used to indicate the impact of scholarly journals – not articles or authors. Researchers often use the metrics to:
Note: The metrics are only available for the journals indexed in the specific citation databases. For example, only journals indexed by Web of Science Core Collection (SCIE, SSCI, AHCI, ESCI) will have journal impact factors.
Journal Impact Factor (JIF)
Journal Impact Factor (JIF) can essentially be defined as the annual average number of citations to papers in any given journal in the two preceding years:

JIF is updated annually and varies every year.
It is only available for the journals indexed in Web of Science Core Collection, including:
Web of Science Core Collection is curated by an expert team of in-house editors, which, as the publisher explains, includes only journals demonstrating high levels of editorial rigor and best practice.
Journal Impact Factor Quartile
The Journal Impact Factor quartile is the quotient of a journal’s rank in category (X) and the total number of journals in the category (Y), so that (X / Y) = Percentile Rank Z.
Note: Journals may appear in multiple Web of Science categories, and are at different quartiles among the categories.
Use and limitations
Access
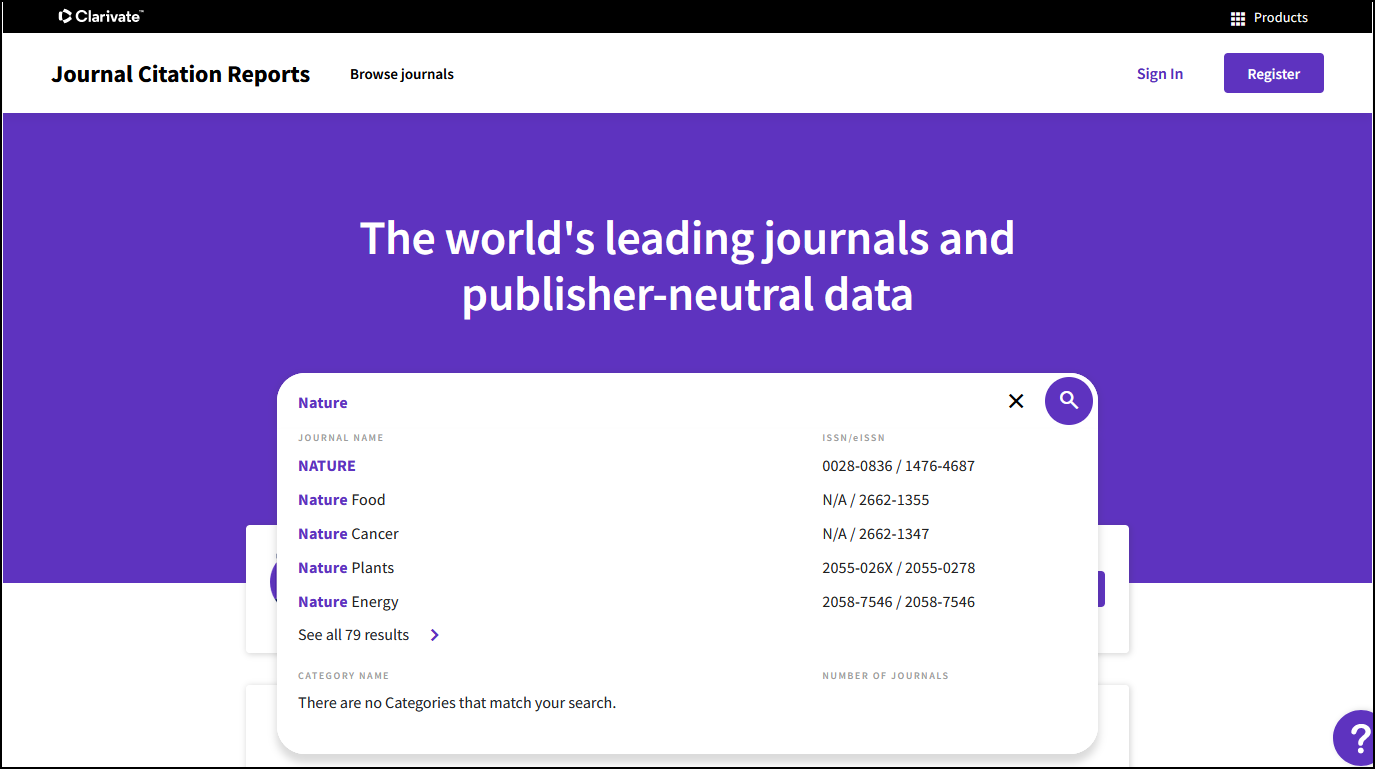
Journal Citation Reports (JCR)

Reference
CiteScore
CiteScore is based on the number of citations to documents (articles, reviews, conference papers, book chapters, and data papers) by a journal over four years, divided by the number of the same document types indexed in Scopus and published in those same four years:

It is calculated annually and available on Scopus. Scopus contents are reviewed and selected by an independent Content Selection and Advisory Board (CSAB), an international group of researchers with journal editor experience, based on their selection criteria.
Use and limitations
Access


Reference
Other metrics are also provided by various databases.
Here are some examples:
Journal Citation Reports (Web of Science)
Access Journal Citation Reports (Web of Science)
| Indicators | Definition | Guide |
|---|---|---|
| 5-Year Journal Impact Factor | The average number of times articles from the journal published in the past 5 years have been cited in the JCR (Journal Citation Reports) year | 5-Year Journal Impact Factor Guide |
| Eigenfactor | Based on 1.) the number of times articles from the journal published in the past five years have been cited in the JCR year, and 2.) which journals have contributed these citations so that highly cited journals will influence the network more than lesser cited journals |
Eigenfactor Guide |
| Journal Citation Indicator (JCI) | A field-normalized metric representing the average category-normalized citation impact for papers published in the prior three-year period. | Journal Citation Indicator (JCI) Guide |
Scopus
Access Scopus
| Indicators | Definition | Guide |
|---|---|---|
| SCImago Journal Rank (SJR) | The average number of weighted citations received in the selected year by the documents published in the selected journal in the three previous years | SCImago Journal Rank (SJR) Guide |
| Source Normalized Impact per Paper (SNIP) | Measuring contextual citation impact by weighting citations based on the total number of citations in a subject field | Source Normalized Impact per Paper (SNIP) Guide |
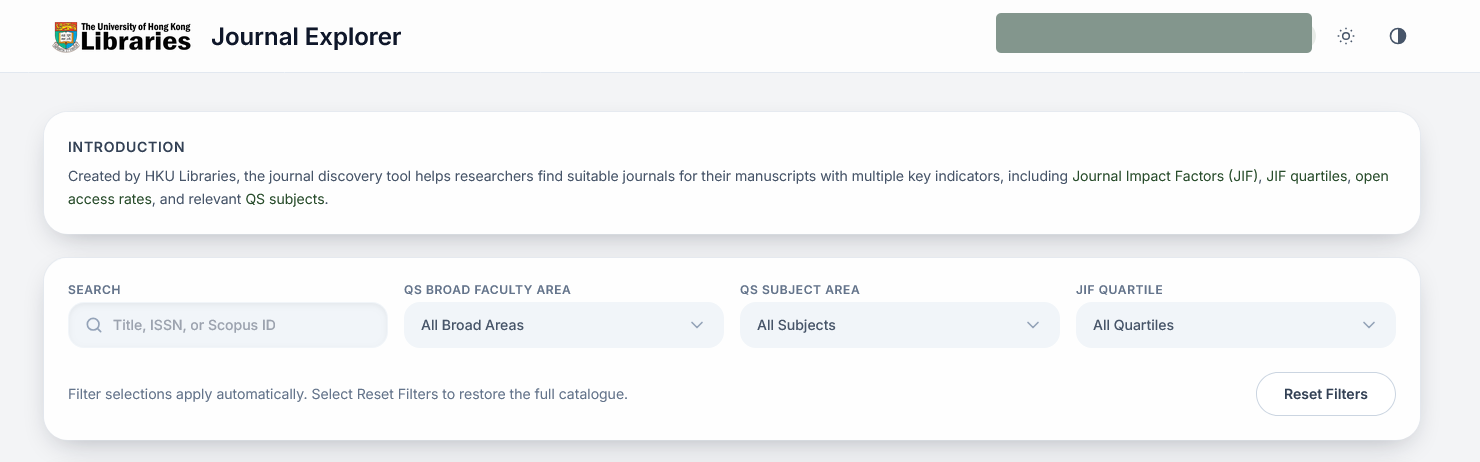
Created by HKU Libraries, the journal discovery tool helps researchers find suitable journals for their manuscripts with multiple key indicators, including Journal Impact Factors (JIF), JIF quartiles, open access rates, and relevant QS subjects.
➡️ Click to use the Tool (Log-in required. Current HKU staff/students only.)