Article Level Metrics

Article level metrics are often used to indicate the impact of scholarly journal articles. The most common metrics base on citations, such as times cited and other field normalized metrics. Again, the metrics are only available for the articles indexed in the specific citation databases.
Such indicators may be used for different purposes, such as:
Recently, altmetrics, which captures the immediate response to the publications in online environments (e.g., social media), are gaining increasing attention. It may be useful for drafting an impact case study, which articulates significance and reach arising from research beyond academia.
Reference
OECD. (2010). Performance-based Funding for Public Research in Tertiary Education Institutions: Workshop Proceedings. OECD Publishing. https://doi.org/10.1787/9789264094611-en
Rice, D. B., Raffoul, H., Ioannidis, J. P. A., & Moher, D. (2020). Academic criteria for promotion and tenure in biomedical sciences faculties: Cross sectional analysis of international sample of universities. BMJ: British Medical Journal, 369. https://doi.org/10.1136/bmj.m2081
Times Cited
The citation count of an article (times cited) is the number of times it is included in the reference list of other articles or books. The numbers are available for only the articles indexed in and specific to the citation databases used.
Use and limitations
Access
Popular platforms include:
Other relevant metrics
A number of calculations (or awards and recognition) are based on citation counts. Here are some examples.
| Indicators | Definition | Access |
|---|---|---|
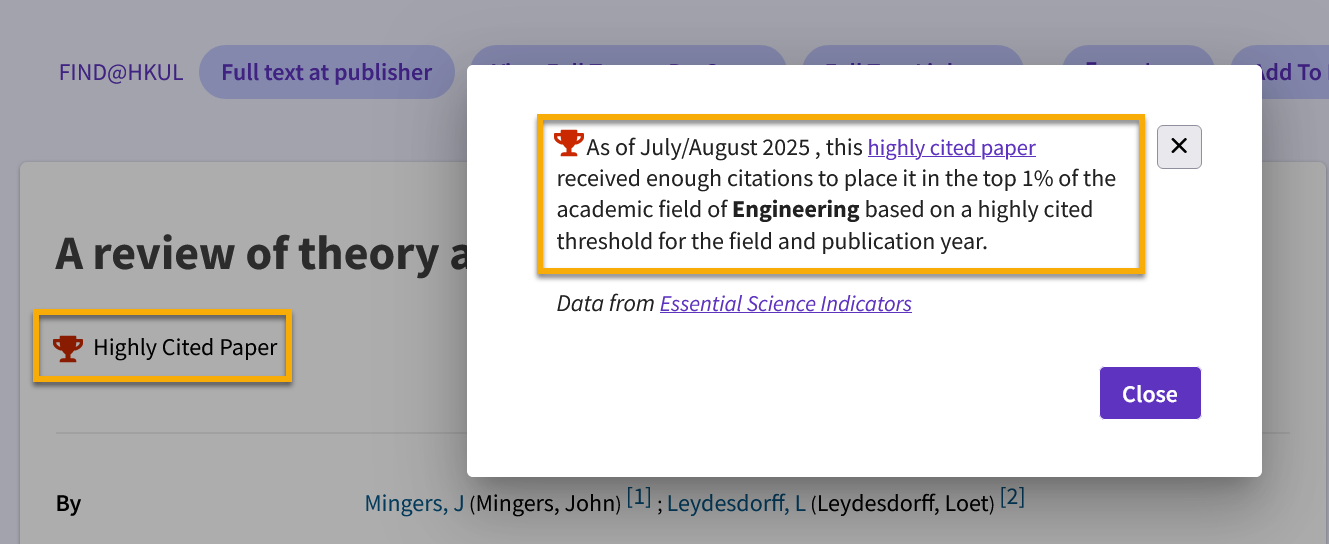
| Highly Cited Paper |
A paper that belongs to the top 1% of papers in a research field published in a specified year. Data updated bi-monthly. |
Click the image to enlarge
|
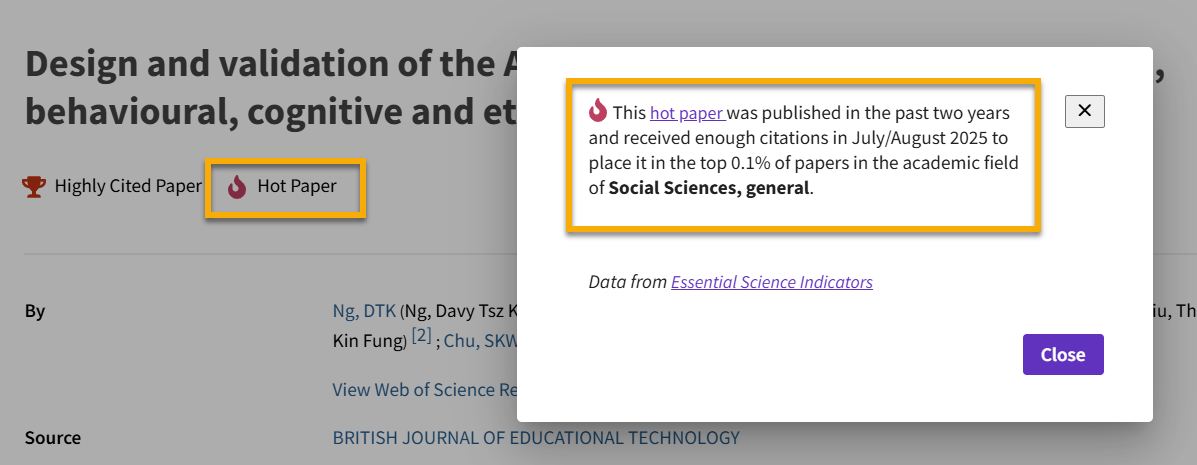
| Hot Paper |
A paper published in the past two years that received a number of citations in the most recent two-month period that places it in the top 0.1% of papers in the same field. Data updated bi-monthly. |
Click the image to enlarge |
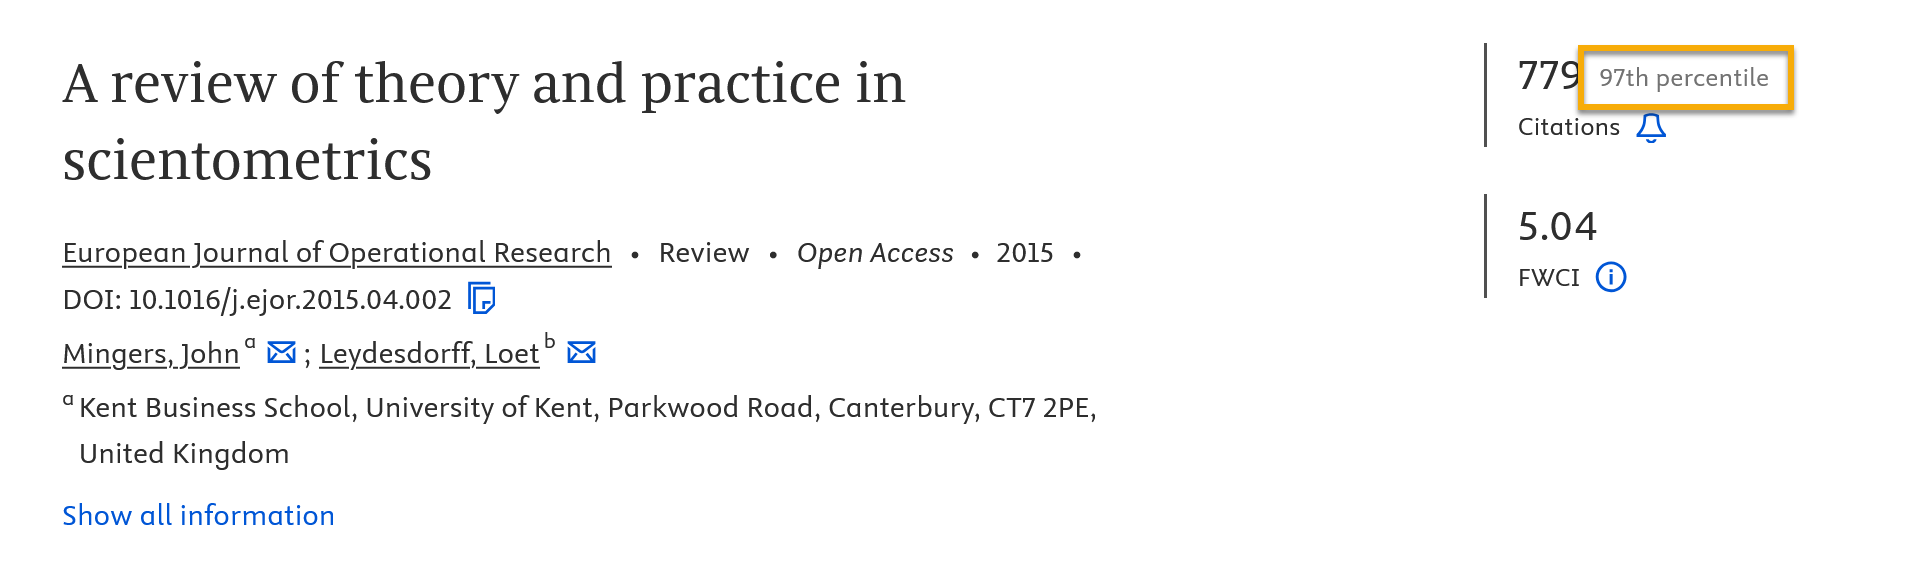
| Percentile (Citation benchmarking) |
Citations received by this document compare with the average for documents in the same publication year, normalized by subject area.
|
Click the image to enlarge |
Reference
Field-normalized citation indicators
Field-normalized citation indicators such as Category Normalized Citation Impact (CNCI) or Field Weighted Citation Impact (FWCI) represent attempts to correct for the citation variability arising from differences between fields, types, and ages of publications. In general:
The numbers are available for only the articles indexed in and specific to the citation databases used.
Use and limitations
Access
Popular platforms include:
| Indicators | Platform | Guide |
|---|---|---|
| Category Normalized Citation Impact (CNCI) | InCites (for Web of Science) | Category Normalized Citation Impact (CNCI) Guide |
| Field Weighted Citation Impact (FWCI) | Field Weighted Citation Impact (FWCI) Guide |
Reference
Citations in Context
Some tools, such as "Smart Citations" by Scite and "Citing items by classification" feature in Web of Science, help to reveal how a scientific paper has been cited by providing the context of the citation and a classification system describing whether it provides supporting or contrasting evidence for the cited claim, or if it just mentions it.
Use and limitations
Access
Popular platforms include:
| Indicators | Platform | Guide |
|---|---|---|
| Smart Citations | Scite | Smart Citations Guide |
| Citing items by classification | Citing items by classification guide |
References
Nicholson, J. M., Mordaunt, M., Lopez, P., Uppala, A., Rosati, D., Rodrigues, N. P., Grabitz, P., & Rife, S. C. (2021). scite: A smart citation index that displays the context of citations and classifies their intent using deep learning. Quantitative Science Studies, 2(3), 882-898. https://doi.org/10.1162/qss_a_00146
Nicholson, J. M., Uppala, A., Sieber, M., Grabitz, P., Mordaunt, M., & Rife, S. C. (2021). Measuring the quality of scientific references in Wikipedia: an analysis of more than 115M citations to over 800 000 scientific articles. Febs j, 288(14), 4242-4248. https://doi.org/10.1111/febs.15608